Monitoring Stock Prices with Grafana and Prometheus
In this article I will show you how you can do long-term monitoring of stock prices with Grafana and get alerts when your stocks rise above or fall below a certain threshold. This can help you to keep an eye on your stocks even if you do not want to check the charts every day.
There has been quite some interest in my previous article about monitoring of stock proces with Prometheus and Molescrape. Since Molescrape is in no state where it can be used by the wide public, this time I want to show you how you can do stock monitoring with a simple custom Python script. We will use Grafana for the visualisation and alerts, Prometheus only as a data storage and a custom Python script to collect the stock data. If you prefer any other backend than Prometheus, of course you can also use another backend supported by Grafana (e.g. Graphite, InfluxDB, MySQL, PostgreSQL, and many more).
Before we start, we have to remember that there are two ways how we can get data into Prometheus. Either Prometheus can pull it from a running service or we can push it into the Prometheus Push Gateway (which is just a proxy, providing a service to Prometheus to pull from). One disadvantage about the Push Gateway is that it does not automatically forget about pushed metrics. This means that our script has to make sure to manually delete old metrics when it cannot find new data for a stock price, anymore. Otherwise, the stock price will remain in the Push Gateway forever and we will think that the price is still the same and everything is OK.
Knowing this, we can start to write a simple Python script that scrapes the data from any data source we want. I will not go into details about any specific site here, just choose any website you consider appropriate for your stocks (i.e. probably from your own country). Let’s start with a list of URLs we want to scrape and iterate over them:
import logging
import requests
import lxml.html
import time


logging.basicConfig(level=logging.INFO)

urls = [
    ('https://stocks.example.com/Alphabet_Inc', 'GOOGL'),
]

for url, symbol in urls:
    response = requests.get(url)
    tree = lxml.html.fromstring(response.text)
    elem = tree.cssselect('#stock-price')[0]
    price = float(elem.text_content())
    logging.info(f'Price of stock is {price}')

    time.sleep(1)  # sleep a bit to not query too fast
You still should add some error handling to this loop, but with these few lines we can already query the stock prices for the stocks we own or want to monitor.
Next, we have to get the data into Prometheus. I expect you already have
Prometheus and the Prometheus Push Gateway installed and they are listening
on the default ports 9090 and 9091.
To push the metrics, we can either install the Python client called
prometheus_client or we can just send an API request with requests. I will
do the latter, since that’s what simple REST APIs are for, we do not need to
install yet another library just to do one simple request.
# ... previous code ...
    payload = '\n'.join([
        '# TYPE stock_price gauge',
        'stock_price{sym="%s"} %f' % (symbol, price),
    ]) + '\n'

    try:
        requests.post(
            'http://localhost:9091/metrics/job/stocks-data',
            data=payload)
    except IOError as e:
        logging.exception(f'Could not push price of {url}', e)
Don’t forget the trailing \n symbol in the payload. Otherwise the request
will not work, as Prometheus expects a trailing newline at the end of the
data.
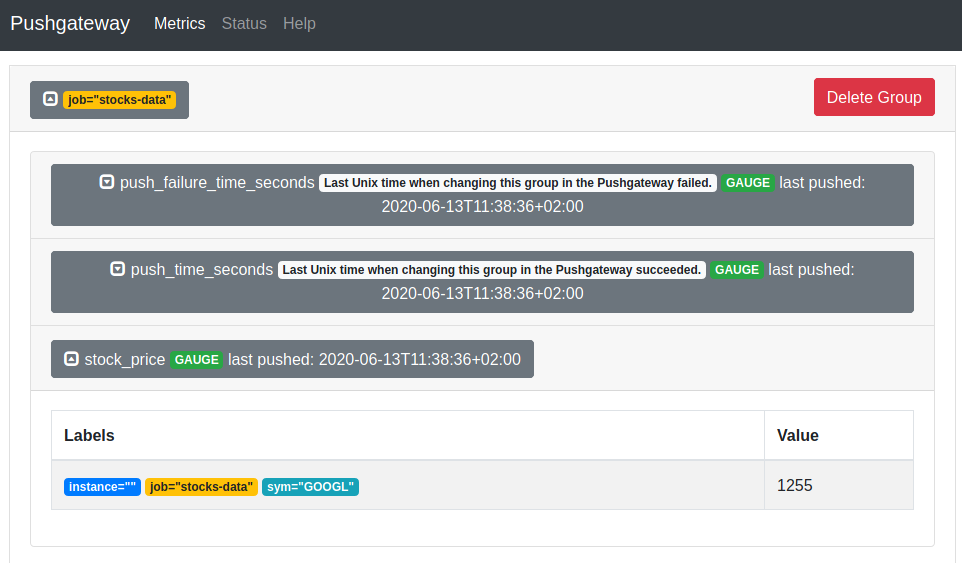
If we now check the web interface of the push gateway at http://localhost:9091
we will already see our pushed data.
To make sure that we do not have any stale data in the Push Gateway, we should delete old data. According to my knowledge it’s only possible to delete all data under a grouping key, so we should delete all data and then ingest all new data. In order to avoid Prometheus collecting the empty data while we are still (slowly) scraping, we will change the structure of the script a bit: At first we will scrape all values, then we will ingest all values into Prometheus.
import logging
import requests
import lxml.html
import time


logging.basicConfig(level=logging.INFO)

# Scrape the prices
urls = [
    ('https://stocks.example.com/Alphabet_Inc', 'GOOGL'),
]

prices = {}

for url, symbol in urls:
    response = requests.get(url)
    tree = lxml.html.fromstring(response.text)
    elem = tree.cssselect('#stock-price')[0]
    price = float(elem.text_content())
    logging.info(f'Price of stock is {price}')
    prices[symbol] = price

    time.sleep(1)  # sleep a bit to not query too fast

# Delete old data and ingest new data
payload = []
payload.append('# TYPE stock_price gauge')
for symbol, price in prices.items():
    payload.append('stock_price{sym="%s"} %f' % (symbol, price))

requests.delete('http://localhost:9091/metrics/job/stocks-data')

try:
    requests.post(
        'http://localhost:9091/metrics/job/stocks-data',
        data='\n'.join(payload) + '\n')
except IOError:
    logging.error(f'Could not push price of {url} to stock')
If your Prometheus is already configured to scrape the Push Gateway, you will see your metrics in Prometheus in the next few minutes. You can make sure that Prometheus scrapes the Push Gateway by checking whether the following section is a scrape target in your Prometheus configuration:
- job_name: 'pushgateway'
  static_configs:
  - targets:
    - 'localhost:9091'
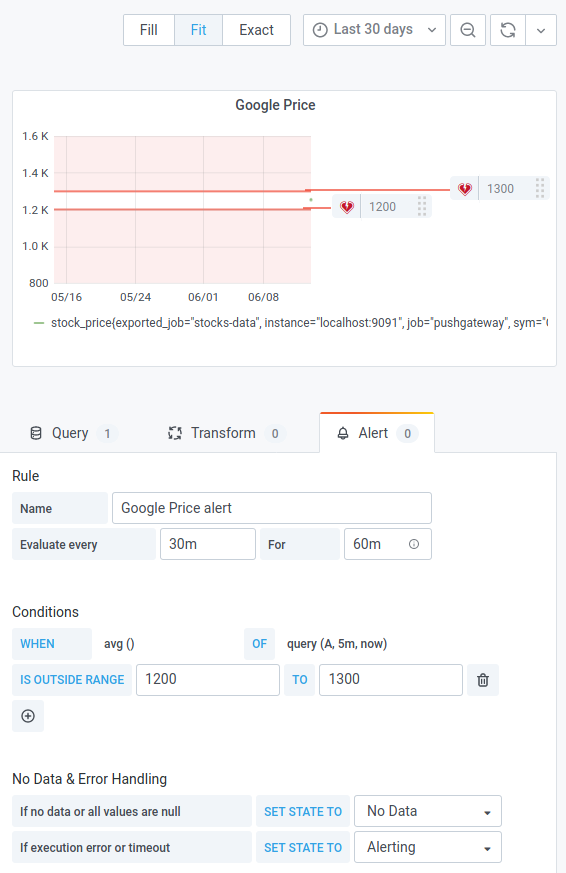
Finally, we can add a new panel in Grafana and retrieve the data from our
label with stock_price{sym="GOOGL"}. For alerting you must first create a
notification channel. I have a setup an e-mail notification channel, but you
can also have other notification channels like Telegram messenger.
Go back to the panel of your stock and switch to the Alert tab. There you can
now create an alert to get informed once the stock crosses a defined threshold.
I usually use the outside range option and define both an upper and a lower
threshold. That way I can keep an eye on my stocks without having to manually
watch them each day.
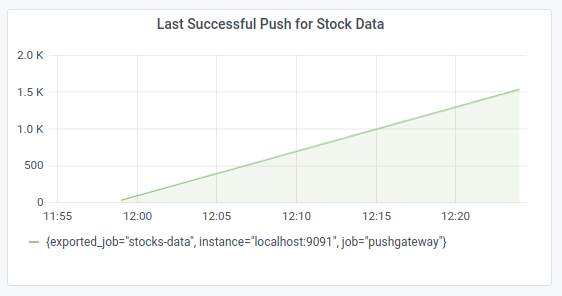
Finally, one more metric we might want to watch is push_time_seconds. This
metric can show us when any data for our grouping key was last pushed
successfully to the Push Gateway. This helps us to determine whether our script runs
at all. That’s important, because if the script does not run at all it also
does not delete old data and Grafana will show fine stock prices!
So, create a new panel with the query
time() - push_time_seconds{exported_job="stocks-data"}. This will give us
the number of seconds since the last successful push. Set an alert to a bit
higher than the interval time of your script.