Howto perform different Monitoring Use Cases with Prometheus
I recently starting migrating all my monitoring jobs from my old service (similar to healthchecks.io and UptimeRobot) to a Prometheus based solution. Even though Prometheus is focused on monitoring numeric metrics from services that expose them on a web interface other monitoring tasks can also be achieved. In this article I want to describe how you can solve different monitoring use cases with Prometheus.
Service Metrics Monitoring
The standard use case of Prometheus is to collect numeric metrics from a service that is running 24/7 and does expose the metrics on an HTTP(s) endpoint.
There are different client libraries available to solve this task, but
you can also do it manually. Prometheus has a very simple format to expose
data: Each metric must be on a new line separated by a space from the
metric value (and optionally a metric timestamp). Lines must be separated
by a line feed character (\n). Otherwise, Prometheus will not parse your
metrics.
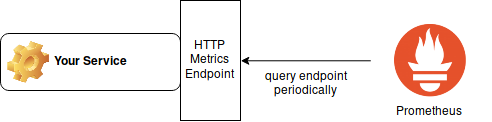
This file has to be published on an HTTP server (Prometheus client libraries might already include a helper function to start an HTTP server in a separate thread), so that Prometheus can query this. In your Prometheus configuration you then specify the hostname, port and path where Prometheus can scrape the metrics for your service.
This system also works well with distributed services, because Prometheus automatically adds the name of the instance (i.e. from where it gathered the data) to your metrics. This means you can run a service on multiple hosts with each instance publishing its own metrics under the same name and later in Prometheus you can distinguish them by instance.
Host Metrics Monitoring
Another common use case for monitoring is operating system monitoring. You might want to know when the hard disk of one of your servers runs full or when your server is constantly operating at 100% CPU load.
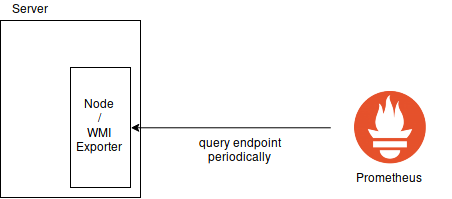
For this, there are special exporters that you can install on your host and that act as a middleman between Prometheus and your operating system. They collect the required information from the operating system from whatever interface the operating system provides and publish them to an HTTP-reachable site.
Of course, you have to make sure that you do not leak private information about your OS that way. Make sure that you have setup your firewalls correctly.
The standard Linux exporter is called node_exporter and the most common Windows exporter is a third-party component called wmi_exporter.
Website Uptime / Up Status Monitoring
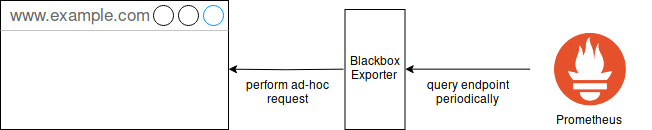
Website status monitoring is one of the tasks I was doing with my own service. This is something that is usually not done by Prometheus, but you can achieve it with a so called blackbox_exporter.
This is another component acting as a middleman. You can query its endpoint by specifying the target URL you want to visit and it will perform an uptime check without any further setup for the queried domains. It will also store additional interesting information like the response time of the website or information about SSL certificates.
The configuration file for the blackbox exporter only has to setup so called
modules that define how you want to query the hosts (e.g. whether to use
IPv4 or IPv6). The actual hosts that should be queried will all be defined
in your prometheus.yml. For this you have to define some relabel_configs
so that Prometheus does not query the given hosts directly, but instead uses
the blackbox exporter. The prometheus.yml then
looks similar to this:
scrape_configs:
  - job_name: 'blackbox'
    metrics_path: /probe
    params:
      module: [http_2xx]  # Look for a HTTP 200 response.
    static_configs:
      - targets:
        - http://prometheus.io    # Target to probe with http.
        - https://prometheus.io   # Target to probe with https.
        - http://example.com:8080 # Target to probe with http on port 8080.
    relabel_configs:
      - source_labels: [__address__]
        target_label: __param_target
      - source_labels: [__param_target]
        target_label: instance
      - target_label: __address__
        replacement: 127.0.0.1:9115  # The blackbox exporter's real hostname:port.
You can now setup several useful
- uptime check for all websites with IPv4
- check whether the website is also reachable with IPv6
- certificate expiry check for all websites (common problem with Let’s Encrypt)
- response time check (I personally do not have an alert on this yet, but I am looking at it from time to time in Grafana)
Cronjob Monitoring
Cronjob Monitoring is another use case I solved with my custom monitoring solution. In this use case I want to know whether a cronjob actually runs in specific intervals. I use this to make sure that e.g. my backup jobs are all running automatically each week. If something fails the backup job will not complete and the trigger signal will not be sent. The monitor will then timeout and send an alert email.
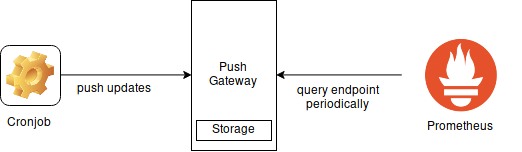
This can be achieved with the Push Gateway of Prometheus. The Push Gateway
is a simple web service to which you can POST metrics and the Push Gateway
will retain them and display them to Prometheus on an HTTP endpoint.
Prometheus can then scrape this HTTP endpoint and collect all metrics.
You can monitor cronjobs or other short living tasks by pushing the
timestamp of the last successful completion to the Push Gateway. In
Prometheus you can then compare this timestamp to the actual current time with
time() - last_success_timestamp to find out how long ago the last successful
completion took place. If this exceeds a threshold
(e.g. one week plus a few hours for a job that should run weekly) you can
trigger an alert.
Of course, with the Push Gateway you can also very easily send other metrics like duration of the job (to monitor whether it gets slower over time) or some domain specific metrics like file size of the tar archive during a backup job (to see how much the file size grows).
I do not maintain a comments section. If you have any questions or comments regarding my posts, please do not hesitate to send me an e-mail to blog@stefan-koch.name.