Monitoring Border Wait Times for Croatia
Croatia is one of the countries in the European Union that is not part of Schengen yet. This means that on entry and exit of the country passports are being checked. Depending on the intensity of the traffic this might lead to long wait times.
Each time I travel to Croatia, I check the traffic reports about border wait times from DARS (Slovenian highway company) and HAK (Croatian automobile club). This allows me to know how long I would have to wait and whether another route might be a better option. One time there was a wait time of three hours on my border crossing plus probably at least one more hour on the toll station in Zagreb. With this situation, it was better for me to use a smaller border crossing and take a detour of 150km and still be 1 to 2 hours faster.
The problem is that both DARS and HAK to my knowledge only display the current live wait times, not historical wait times. This, however, does not help me at planning my trips at all. Usually, I start to think about my trips a few days in advance. Then I’d like to find out at which time it’s best to cross the border. However, weekdays and weekends are very different with regards to border wait times and thus when I start to think about my trip on Wednesday, there’s no way anymore to find the typical wait time on Saturdays.
A small side note here: Google Maps does not seem to be the best tool to predict border wait times, either. When there was a wait time of three hours at Macelj / Gruškovje, Google only estimated a delay of around one hour. From the traffic jam I saw on my trip in the opposite direction, it’s pretty clear that the traffic jam was much longer than one hour and that the numbers from HAK and DARS (three hours) probably were much more accurate.
Implementation
Thus, the question for me has been: Can I implement a system to collect and visualize border wait times (Attention: the website has extremely long load times at the moment), so that I can make an informed guess on when I should drive to Croatia or back home and have a short wait time.
I am already running a web crawling and scraping framework called molescrape.com (update 2020: discontinued) with multiple projects and spiders. This tool came in very handy for this use case.
Scraping the Wait Times
I collect the wait times every 15 minutes from the English Mobile website of HAK. For this, I use a Scrapy with a very simple spider and a small class to parse HTML tables. I chose the English and mobile version of HAK, because it is much simpler than the Croatian version.
Wait times are displayed for both passenger cars and heavy duty vehicles for both directions (entering Croatia and leaving Croatia). I am only interested in passenger cars, but I still collect both vehicle types. For each page visit I store the currently displayed wait time for each border crossing together with the current timestamp, the direction and the type of vehicle.
At this point, the stream of data looks like this:
[{
    "crawl_time": "2018-09-09 19:06:12",
    "crossing": "Macelj (Gruškovje)",
    "direction": "entry",
    "waiting_time": "1 h 30 min.",
    "type": "car",
}, {
    "crawl_time": "2018-09-09 19:06:12",
    "crossing": "Županja (Orašje)",
    "direction": "exit",
    "waiting_time": "0–10 min.",
    "type": "car",
}, {
    ...
}]
Processing
In molescrape, each item returned from Scrapy is currently sent to MQTT
and stored to Amazon S3 (both with a custom Pipeline in Scrapy).
MQTT can run custom postprocessing and after that the data can be stored to a
database. I am currently working on replacing MQTT with Apache Kafka.
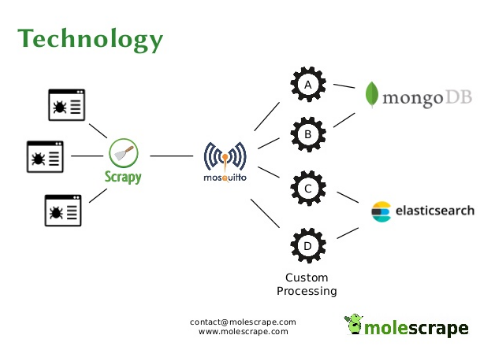
For the border wait times I do not have any postprocessing at all, data just gets copied to a MongoDB database. This is mainly because my current setup with MQTT can only process one item at a time (independent from all other items), but for the border wait times I’d have to clean and aggregate the data per hour. Since I am planning to replace MQTT anyway, I did not spend any time on improving the architecture.
Visualization
The data then gets visualized on a simple website. In fact, I have one web service that provides the data on a REST interface and another website that only serves the HTML pages. Both websites are programmed with flask on the server-side. The data then gets visualized with Plotly. Initially, I wanted to use and learn raw D3, but this has proven to complicated and time-consuming for basic plots.
My data web service reads the data from MongoDB and does all the aggregation without any caching. Thus, at the moment, requests are quite slow. To solve this problem I want to do all the aggregation in a postprocessing step on Kafka. I am also thinking about implementing caching in my data web service, because it will probably come in handy for many other projects as well.
The data is then used by a simple website which only does the visualisation with Plotly. For the start, I created one plot that gives me an overview over the wait time for the past and current month and a map view with the current wait times at different border crossings.
In the future, I want to extend this with a chart about an average week (to decide which time and which weekday is the best) and I want to make a small machine learning project and traing a model to estimate the wait time during the next few hours. With this I could look at the estimated wait time already at home.
Difficulties
Of course, there have been several difficulties during development. At first, the website from DARS has been a problem regarding scraping. They are fetching the wait times with AJAX and I was not able to find out which document is supposed to contain these wait times (they are post-fetching so much data on their website and I could not find a document, that contained wait times in clear text). So, currently I am only using the data from HAK even though it would be better to use both, because sometimes they have different numbers.
Generally, if you want to crawl a website that displays some data using Javascript, there are several options:
- You can use a browser technology that supports Javascript (usually people use a headless Chrome in this case). This has the advantage that Javascript gets parsed by a real browser and thus should work quite well, but the disadvantage that it’s quite a lot of overhead.
- You can check if you can parse the same information from the Javascript source code somehow. Sometimes the information you need is available in the Javascript code and will be embedded into the HTML DOM with Javascript. In this case, you can just use a regular expression on the raw source code.
- If the information is fetched via AJAX, instead of visiting the main site you can just request the AJAX endpoint directly.
Apart from my problem with DARS, there have only been a few minor difficulties, just like in every other software project. For example, as you can see in the data excerpt above, wait times from HAK are given in a human readable format. To process this with a machine, it has to be parsed.
Furthermore, we do not get any information if the wait time is zero minutes. If we knew all the border crossings in advance, we could emit a Scrapy result with wait time zero minutes for each border crossing that is not listed on the website. However, this is not how I structured molescrape. I want to keep crawling as clean as possible and the processing should be done afterwards.
For aggregation I am currently grouping the crawl results into hourly bins. Each bin that does not have any border wait time attached will be set to zero minutes wait time. Since HAK does update their website more often than once per hour, this will probably lead to a bit more wait times on my overview than on theirs, but that’s OK for me. I do not think that their data is accurate by the minute either, I cannot plan my arrival at the border on the minute and the wait time from last week will not look exactly the same as the current week. Taking all of this into account, it does not matter if my system displays a wait time of 30 minutes for 3pm and only goes to zero minutes at 4pm even though HAK already had it set to zero minutes at 15:30.
Findings
So, what did I find out? I started collecting the border wait times at the beginning of August and started analysing it at the end of August. In August a lot of people are driving to holiday in Croatia - or rather return from holiday as we can see from the data. The blue line depicts the wait time for people entering Slovenia (which is the direction in which Central European people are driving when they finish their holiday in Croatia), the orange line is the wait time for people entering Croatia. Both lines only visualize the wait times at the border crossing Macelj / Gruškovje.
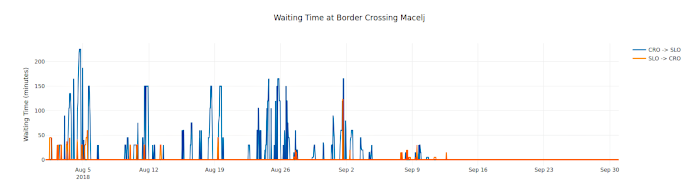
From the data we can see quite clearly that on weekends the wait times are much longer than on weekdays. I think this is an expected situation. What really surprised me, however, was that the wait times seem to be longer on Saturdays than on Sundays. Seems many people prefer to return from the holidays and then still have one day at home before they have to return to work.
I also did one plot for an average day of August to find out during which hours of the day it would be best to arrive at the border crossing. This plot showed quite clearly that for the border crossing Macelj / Gruškovje the busiest hours are between 11am and 8pm (CEST).
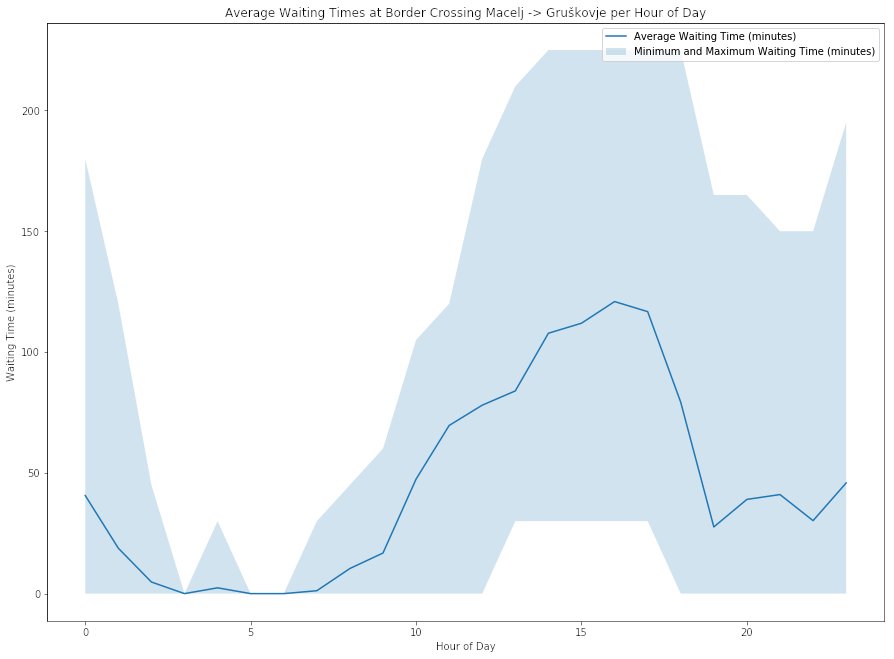
This probably means that I will try not to return from Croatia to Austria on Saturday afternoons. A better time would be an early morning during the week or on Sunday if it has to be on the weekend. Late evenings on Sunday according to the data (and my own experience) are also OK, but there might be some more traffic from Croatians commuting to Zagreb then.
I do not maintain a comments section. If you have any questions or comments regarding my posts, please do not hesitate to send me an e-mail to blog@stefan-koch.name.