Failure Detection for Molescrape: Anomaly Detection on Daily Signals
At my scraping platform molescrape.com, I have setup a constant monitoring of the number of items collected per spider to detect when a spider fails (e.g. because of system problems or because the website changed). Currently, the threshold has to be set manually for each newly added spider. As this is increased effort for the user, I have been working on a system to automatically detect a useful threshold.
Since I am working mostly with newspaper data at the moment, I will focus on newspaper articles in this article. We already had at least two known failures during the past 7 months, so there are samples to see whether the algorithm will detect an outage.
Our monitoring system tracks the number of articles crawled per day. The numbers are updated live, but we will not use the live data in this article. Instead, we only focus on the total number of items at the end of each day.
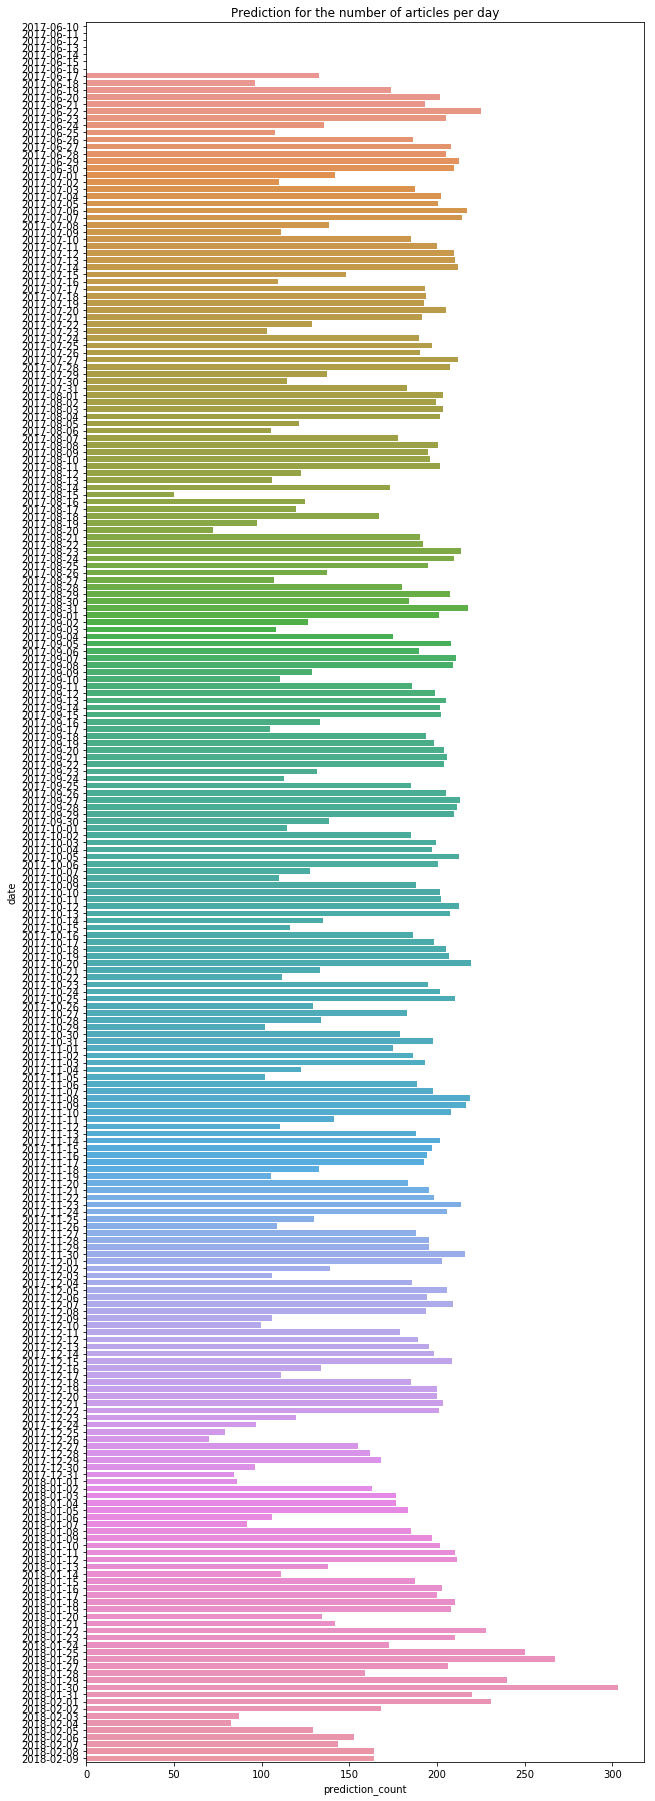
Let’s have a look at our data first. In the figure, you can see the daily stats for the number of articles of a newspaper. Remarkable days are 2017-08-16 and 2018-01-23. On these two days we had system failures and thus the number of articles is way too small. 2017-08-14 and 2018-08-15 are missing in the plot altogether, because there we had 0 items. On the other hand, the week between Christmas and New Year’s Eve also has a remarkably low number of articles per day, but this should not be detected as an error. People go on holidays during this week, so it is natural that the number of articles is lower.
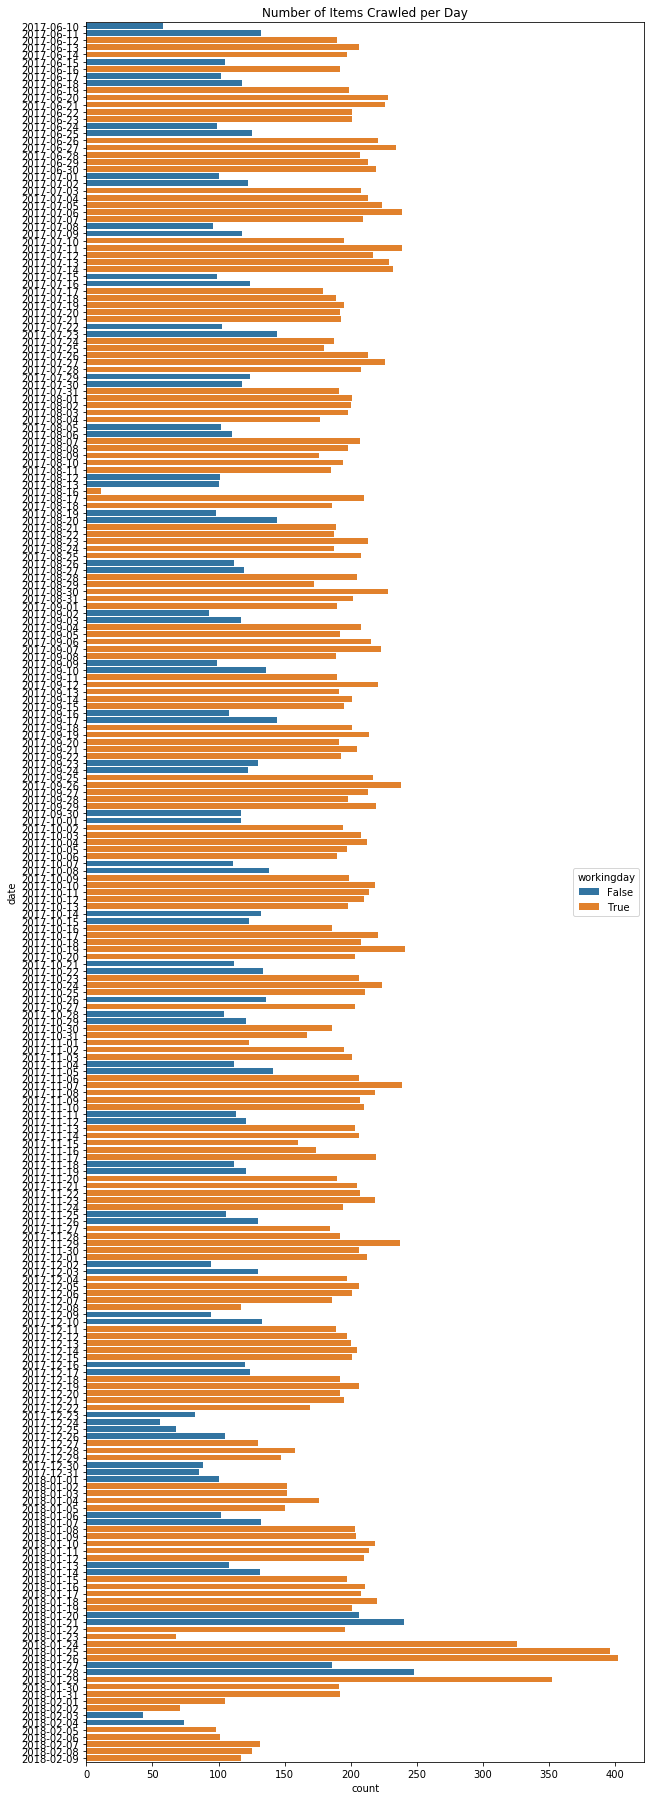
At the lower part of the graph in 2018 we see two anomalies that are not a result of the crawling process. When items have been crawled, they are pushed to a postprocessing step. This postprocessing step was based on monthly batch processing in 2017 and I switched to live processing through a message queue in 2018.
At the end of January 2018 we see a very high number of articles, actually too many articles. These are probably duplicate entries, because both postprocessing systems (batch and live) were running at that time. Looking at the data for February 2018 on the other hand, there are too few articles. I compared these numbers to the numbers from my crawling monitoring (which counts the number of items before postprocessing) and the number of items per day should be around 180-210 items instead of 100-130. So, there seems to be a problem in the new live postprocessing system.
If our model would be able to detect these events as an error, that would be highly appreciated. However, it is not absolutely necessary, because for postprocessing errors we could just compare the crawling log to the postprocessing log. Thus, we will focus on the events from 2017-08-14 to 2017-08-16 and 2018-01-23 at first.
As you can see from the figure, I already marked weekends and national holidays in blue. The number of articles on weekends is significantly lower than the number of articles from Monday to Friday. This is a problem for an anomaly detection algorithm, because it looks like an anomaly, but it is a natural behaviour.
There are two ways how we could try to tackle this problem:
- time series algorithms that can handle periodic changes in the numbers
- including day of week as input into our model
Twitter’s luminol
From these two variants we will first have a look at the existing algorithms.
Twitter created a Python library called luminol,
which can detect anomalies in time series data.
Luminol supports a few different algorithms for anomaly detection. For example,
the algorithm derivative_detector works by looking at the derivative of the
signal. I tried this one at first and plotted all the scores above a
threshold of three.
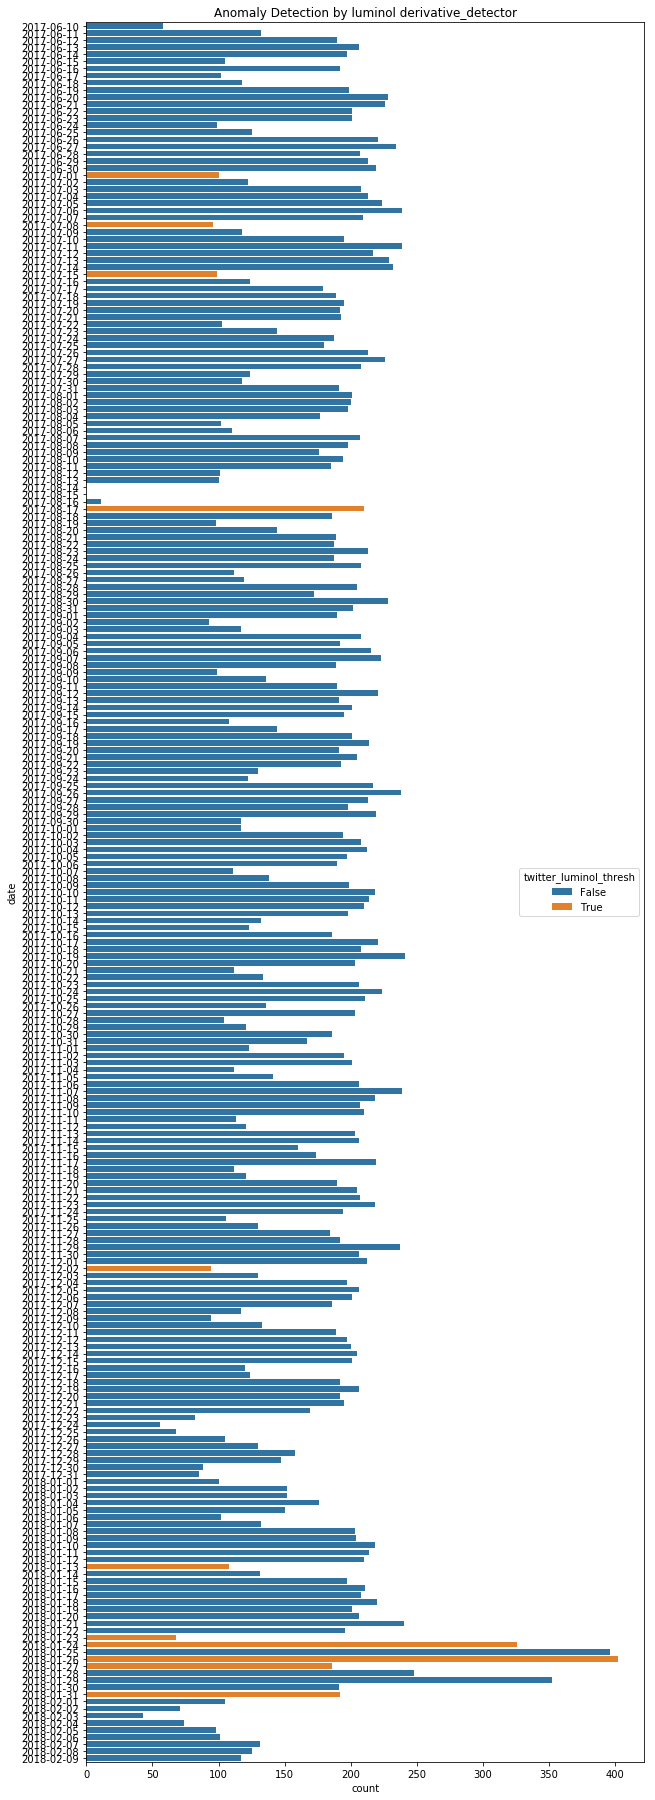
We can see that there are a lot of classification errors in this plot. For example, all 1st, 8th and 15th of July 2017 are classified as failures even though these dates are just ordinary Saturdays. The failure during 14th to 16th of August on the other hand is not detected, probably because it follows a weekend and thus the derivative is not high enough. Only the day after I had fixed the problem is detected as an anomaly, because our signal rises from 10 to more than 200 articles per day.
Maybe I just chose the threshold badly? We can already determine that this is probably not the case, because we found 4 false positives and 3 false negatives. By moving the threshold we cannot fix both errors. We could only change the threshold in a way that the false positives are not classified as positives anymore (make the threshold more strict) or in a way that false negatives are classified as positives (make the threshold more inclusive).
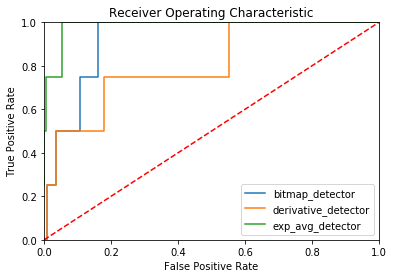
Still, let’s see the ROC curve to get an better overview over our anomaly detection.
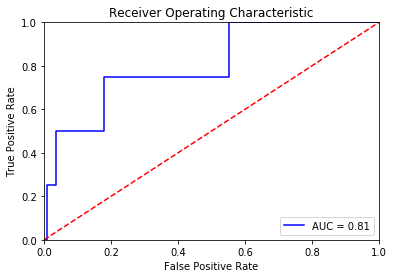
The meaning of the ROC curve totally depends on the task at hand. In our case, this ROC curve is a disaster. For a molescrape failure, we want to have a true positive rate of 1 and a very low false positive rate. A false positive rate of 0.5 would mean that every other day we receive a mail about a system failure. After one week, we’d happily ignore the mails.
To put this result into context, I created the ROC curve for a simple classifier that classifies the days solely based on the number of articles. If the number of articles for a day is below the threshold, it is considered a failure. For the generation of the ROC curve different thresholds are tested (e.g. 0 articles, 10 articles, 50 articles, 100 articles and so on).
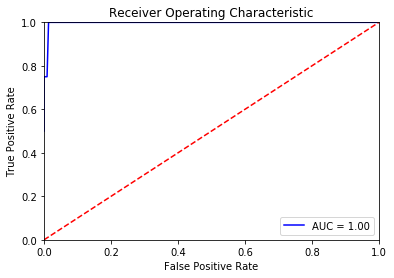
With such an approach we can achieve a TPR (True Positive Rate) of 1 with almost no false positives. This is the way we’d want the ROC curve to be.
Next, I tested the other algorithms from luminol which led to the following
ROC curves. The best algorithm is exp_avg_detector, but with a FPR (False
Positive Rate) of 0.05 at TPR 1 it still falls short
of my simple threshold-based approach. A false positive rate of 0.05
means that every 20 days we receive an alert for an event that is not an
actual failure.
ROC Curve
A ROC curve is a method to visually analyze a binary classifier that is based on a threshold. The ROC curve visualizes the true positive rate (good) against the false positive rate (bad) for different levels of the threshold, so it allows us to see which true positive rate/false positive rate trade-off we can achieve with a given model.
Rolling Averages
Another idea was to create a predictor and then use the difference between the prediction and the actual number of articles as a foundation to decide whether we have a failure or not. A rolling average is a very simple form of prediction. We use the number of articles from the past days and assume that on the next day approximately the same number of articles will be published. As we saw before, this is not true on weekends, but we will get to that later.
With a rolling average of 14 days, I was able to get a perfect ROC curve, meaning there is a decision threshold that splits our data perfectly into positives and negatives.
However, one problem remains. The system should be automatic and it should work for all crawlers. We were only able to perform this data analysis with ROC curves, because I already have a lot of data including failure samples. Without samples for failures, the algorithm would not be able to choose a valid decision boundary. On the other hand, we cannot determine it manually, because absolute numbers will be very different for each crawler. Some of my crawlers have 5 items per day, others have thousands of items per day.
I tried to find a relative decision boundary, but this did not work very well. Whatever value I chose as the decision boundary, I did get false positives or false negatives.
Including the Day of Week
Since we were not able to find a very good general model solely based on the number of articles, let’s include the day of week into the calculation. Based on the number of articles for the previous seven days and one bit for the day of week (weekend or not) we can create a quite good predictor for the number of articles per day.
With this predictor I was able to choose a relative threshold. If the actual number of articles is less than half of the predicted number of articles then I will trigger an error event. This leads to zero classification errors, so all failures are detected and no false positives are reported. Regarding the events in February 2018, we would get three notifications and then the prediction adapts to the lower number of articles.
Conclusion
The described adaptive approach for failure detection in molescrape can help to detect failures more quickly. The current approach often detects failures only after two days, because I set the threshold quite low to ensure that weekends or holidays do not get detected as system failures.
However, I would not rely on the adaptive approach alone, because it is more error-prone. A combination of both failure detection schemes could provide the known stability and a faster alert time. The fixed threshold would then be set quite low to ensure that we detect total failures accurately and the adaptive scheme could be used to try to detect the problem already on the first day.
I do not maintain a comments section. If you have any questions or comments regarding my posts, please do not hesitate to send me an e-mail to blog@stefan-koch.name.