Health Monitoring and yet another Health Status Monitoring Service
When you’re running websites or any other service you want to know its state at any time and be informed when something goes wrong. For example, I started molescrape almost one year ago and during long-term website crawling you need some form of application monitoring. During the first few days, you might check the status of the crawling manually, but some weeks later you won’t. And at some point in time your application will fail. And you will need to notice, or you will go days or even weeks without noticing. In this article I will give a short overview over monitoring solutions (especially simple ones for hobby projects) and introduce my own monitoring solution.
The Big Players
The most important FOSS monitoring application I know of is Nagios. It’s quite old and still seems to look as old as it used to, but it has a lot of plugins and flexibility. Nagios has also been forked a few times in the recent history. There are Icinga, Shinken and Naemon.
On the SASS side, Datadog is probably the biggest player at the moment. They support so called Integrations to monitor different parts of your system and different applications, Graphing to create charts for the sysadmins and also Alerting to send out notifications.
Both of them have a lot of monitoring capabilities, but also come with either effort for setting up (Nagios) or have a price tag attached (Datadog, if you want alerts). So, these solutions are best suited if you can invest money or a few days of time. However, for hobby projects you usually lack both.
The Web Services
Apart from the standard applications, there’s a large ecosystem of web services for simple application monitoring to check if your applications are still running or not. The first two I came across and still use are:
Healthchecks is a service for monitoring cronjobs or other periodic applications. Whenever your application has finished successfully, you will call a HTTP endpoint to tell Healthchecks that your application ran. If Healthchecks did not receive a request for a defined amount of time, they will send you an alert notification.
UptimeRobot on the other hand is used for websites that should be available 100% of the time, but cannot send status notifications on their own. To generalize, it is used for event-driven services. Currently, they support HTTP, standard pings to hosts and requests to ports.
Apart from these two, there are more services with more specialized features:
- Cronitor: As the name says, this service started with cronjob monitoring. Unlike Healthchecks, they also support an API to send two different commands for job start and job finished events. Additionaly, they also support website monitoring like UptimeRobot (called Healthchecks on their site).
- DeadMansSnitch: Another service that monitors periodic applications like cronjobs. Unlike for other services, you can also send additional information like messages with each notification.
- Steward: This is another service to monitor cronjobs or periodic application execution, but according to the documentation they seem to enforce explicit authentication (with an API key) during each ping.
- CronAlarm: Again periodic job monitoring, but with more focus on the actual runtime of the jobs.
- Pingdom: A service for website uptime monitoring. Less monitors in the free plan than UptimeRobot, but checks from different server locations in the paid plan.
- Coal Mine: A self-hosted FOSS application.
Use Cases
In which situations should you use which monitoring system? Generally, if you need more details about actual runtimes or data rates in different applications, you will probably need one of the big players like Nagios or Datadog. The simple services are just not focused on this, only CronAlarm mentions runtimes in their documentation.
If on the other hand, you just need a status up/down, you should probably prefer any of the simple services. With Nagios you will invest a lot of time in setting up Nagios and Datadog has a hefty price tag for hobby projects (currently 180$ per host per year and the free plan does not help if you want to have alerts).
So let’s see what we can do with a simple monitoring. The most simple use case that most services advertise is cronjob monitoring. You have a job that runs each hour, each day, each month or similar and you want to know whether it finished successfully.
Next use case is monitoring for an application that has to run often, but not on exactly defined time intervals. For example, my Molescrape spiders will run every few minutes, but not on defined intervals. I allow a restricted number of spiders to run at the same time and runtimes for jobs are not known in advance. However, if jobs are blocked for more than 10 minutes I know that something is definitely wrong. Thus, we can use a standard cronjob monitoring for this use case and just set the interval to 10 minutes.
Apart from simple uptime monitoring, you might also want to know the runtime of your jobs. One of the services mentioned above also solves that use case. Let’s say you have a job and you know that it might take longer with more data, but you want to make sure that it never takes longer than 5 minutes. In this case, you could set an alert to 4 minutes and just take action when this limit is reached.
At Molescrape I also have the use case that I expect at least a defined number of new pages per time interval (usually per day). However, I do not know when exactly they will be found. It’s possible that I expect at least five new news articles per day, and the newspaper releases three in the morning and four in the evening. This would be only two pings with an interval of a few hours, but seven articles. This problem, unfortunately, cannot be solved with cronjob monitoring
Of course there’s also the use case solved by UptimeRobot and similar services: You want to make sure that your website or any other service (e.g. a REST API) is reachable and works correctly all of the time. UptimeRobot only checks for availability of a system, not for it’s correct behavior (e.g. for REST APIs). Other services allow this, but cost money. However, it’s also possible to simulate the same behavior with a cronjob monitor. Just setup a cronjob that executes a testing framework every few minutes and at define a cronjob monitor with the same interval. From your unit testing framework you call the cronjob monitor only if the tests are OK. If your tests fail you do not send a ping and the cronjob monitor will alert you, because it expected one ping.
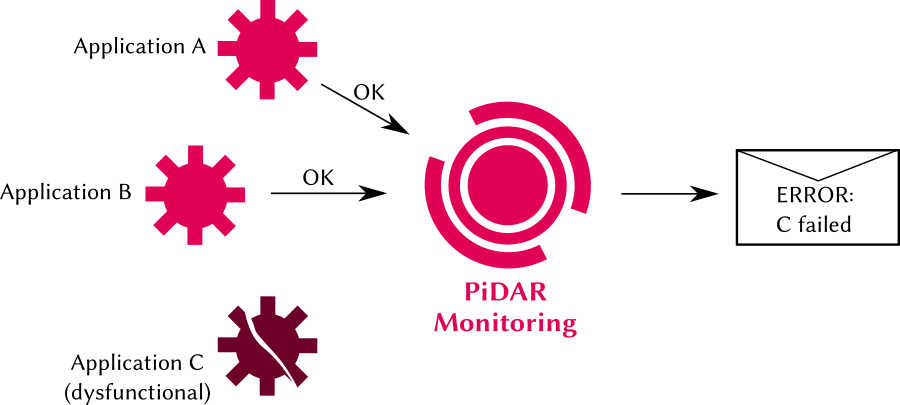
PiDAR - Ping Detection and Ranging
Since I have some more advanced monitoring requirements at Molescrape that could not be fulfilled with Healthchecks and UptimeRobot, I started to create my own monitoring service called PiDAR. PiDAR (Ping Detection and Ranging) is a pun on Lidar (Light Detection and Ranging) which is one of the sensors used for autonomous cars or Advanced Driver-Assistence Systems. And as much as you need sensors for autonomous driving you also need sensors (i.e. monitoring) for any service that should run on its own.
PiDAR is built with Flask and PostgreSQL as the database. At the time of writing, it only supports monitoring for periodic jobs. However, for the future I have planned a counting monitoring (to check if specific number of pings are reached during a specified time interval), status checks for websites or other event-driven services and maybe some more checks.
The cronjob monitors at PiDAR are called Pings, because you basically send a ping from your application to PiDAR to announce that you are still OK. The counting monitor will probably also be built on top of Pings and just count the number of times you called the endpoint.
So, what will I be using these different monitors for and why are the existing technologies not enough for Molescrape?
One important point is costs. I start hitting the limit of 20 checks at Healthchecks and since Molescrape currently is still a hobby project I am not willing to afford 20 Euro / month to upgrade to 50 checks - which is not so much more anyway. Since Molescrape is built on projects and spiders I might want to have one monitor per spider to check if each spider is actually running. Currently, I only have one Healthchecks monitor on the full crawling process (all spiders together) and implemented a custom monitoring in Molescrape for the number of items crawled. The custom monitoring then sends out e-mail alerts if one spider falls behind the expected number of items per day.
With the Pings and counting Pings monitoring system at PiDAR I can establish one Ping monitor for each spider and one counting ping for the number of elements each spider crawls. This will allow me to remove the custom monitoring from Molescrape so that Molescrape can fully concentrate on crawling instead of monitoring. I also integrated public dashboards into PiDAR so that I can display the status of my crawling projects on the respective project websites (UptimeRobot has dashboards, but Healthchecks to my knowledge does not).
The websites and user-facing services of Molescrape are currently monitored by UptimeRobot. This will also be integrated into PiDAR in the future to have all monitoring in one place.
PiDAR at the moment is free of charge, so you can try it and see if it suits your needs.
I do not maintain a comments section. If you have any questions or comments regarding my posts, please do not hesitate to send me an e-mail to blog@stefan-koch.name.